Data Science - Interview mit den Studierenden der TH Köln
DATA STORIES | JOB MARKET ANALYTICS | KNIME ANALYTICS PLATFORM
Job Market Analytics: Findings from the Data Science for Business Challenge at TH Köln
My Data Guest — An Interview with TH Köln Challenge Winners
The interview appeared originally in: https://medium.com/low-code-for-advanced-data-science/job-market-analytics-findings-from-the-data-science-for-business-challenge-at-th-k%C3%B6ln-671050501818
---
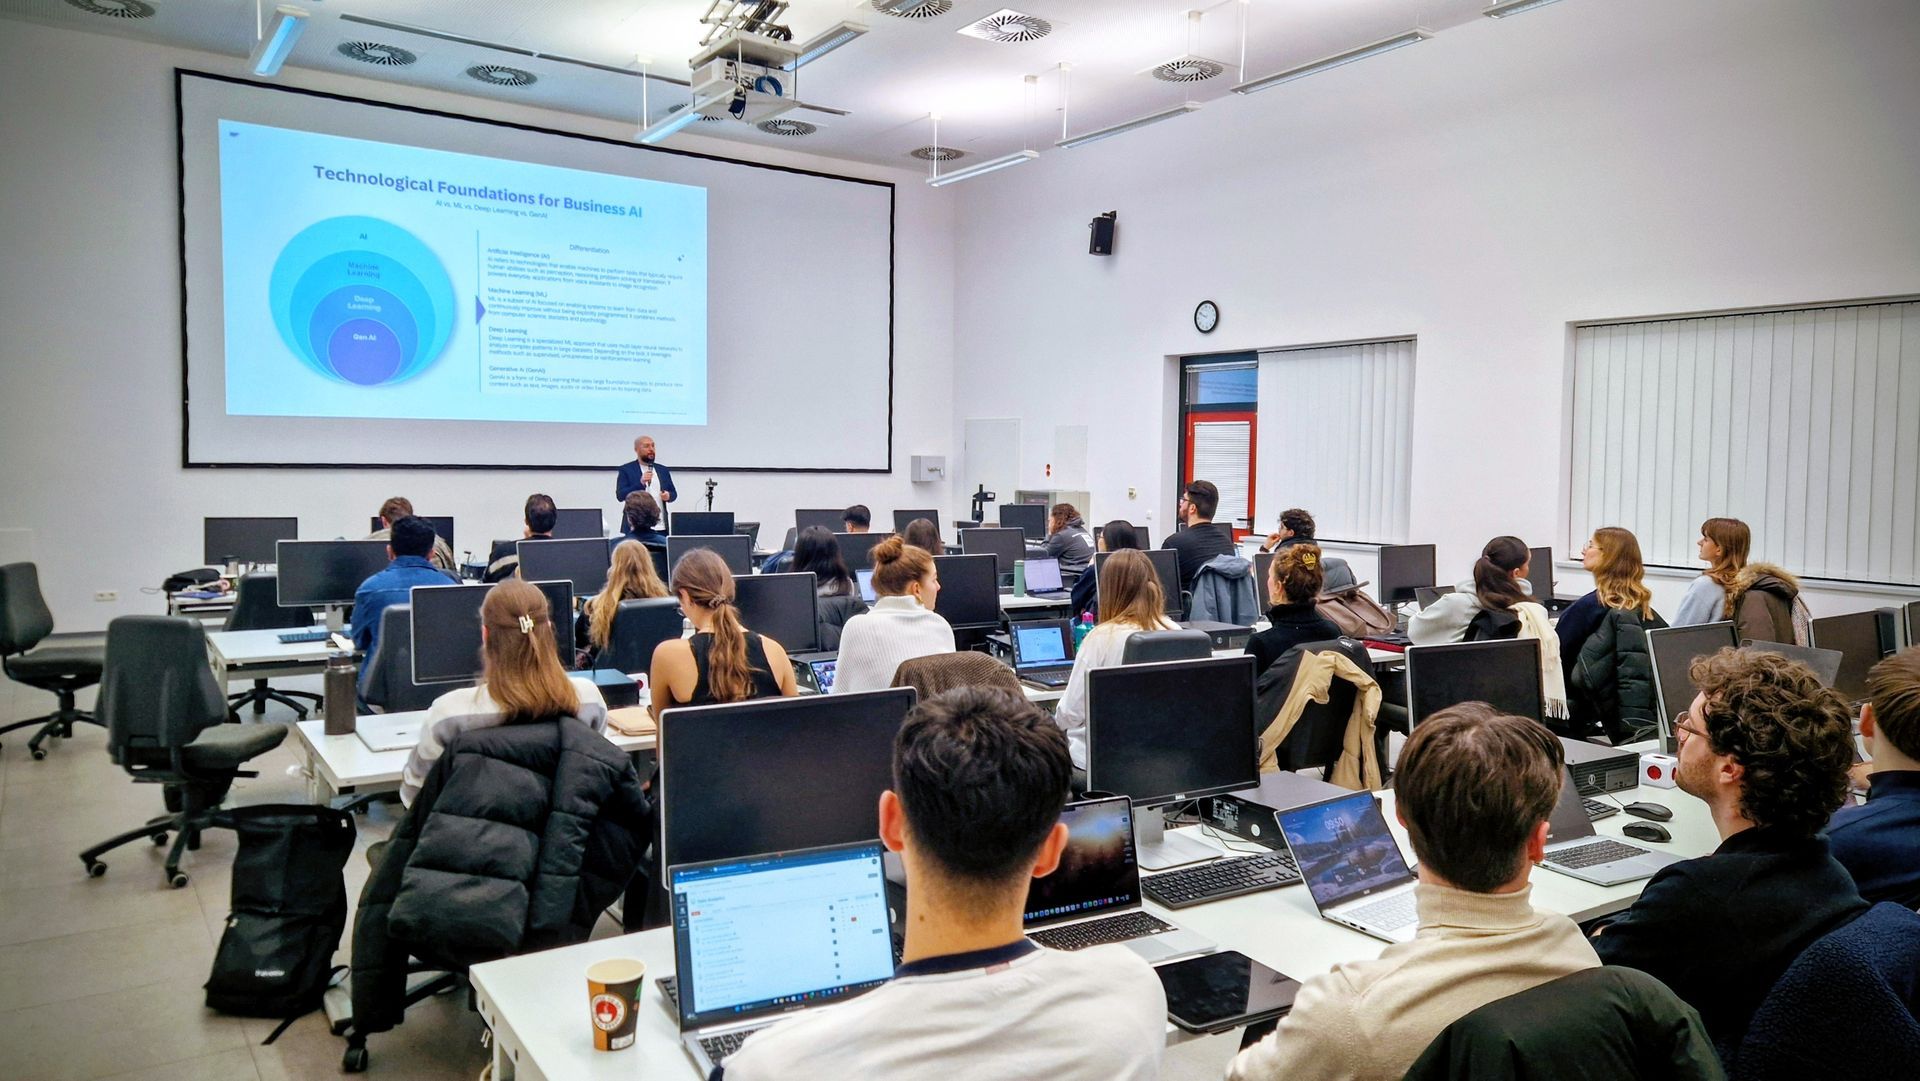
In this new episode of My Data Guest, we are leading a discussion with Prof. Dr. Tobias Schlüter and his group of students who won the 1st Place in the Data Science for Business Challenge “Finance & HR” with KNIME in Fall 2022.
This initiative was jointly organized by KNIME and Prof. Dr. Tobias Schlüter within the Data Science for Business lecture at the Technische Hochschule of Cologne, Germany. Additionally, the challenge benefited from the collaboration and practical support of players in the industry, such as ParcIT, PWC, and KDU.
In the Data Science for Business Challenge “Finance & HR”, which started in October 2022, 7 teams worked on different issues of risk, pricing, social media and job market analytics.
The best two teams developed solutions in “Job Market Analytics”, where they analyzed the German job market for data science professionals and chose quite different approaches to achieve their goals. After scraping the web, they got around 20,000 job advertisements in Germany in areas such as data science, data analytics and business intelligence. Then, they moved on to KNIME Analytics Platform and performed various tasks like text mining, information retrieval on demanded skills, and finally data exploration and geospatial analysis in order to present the profiles of well suited applicants for the job offers.
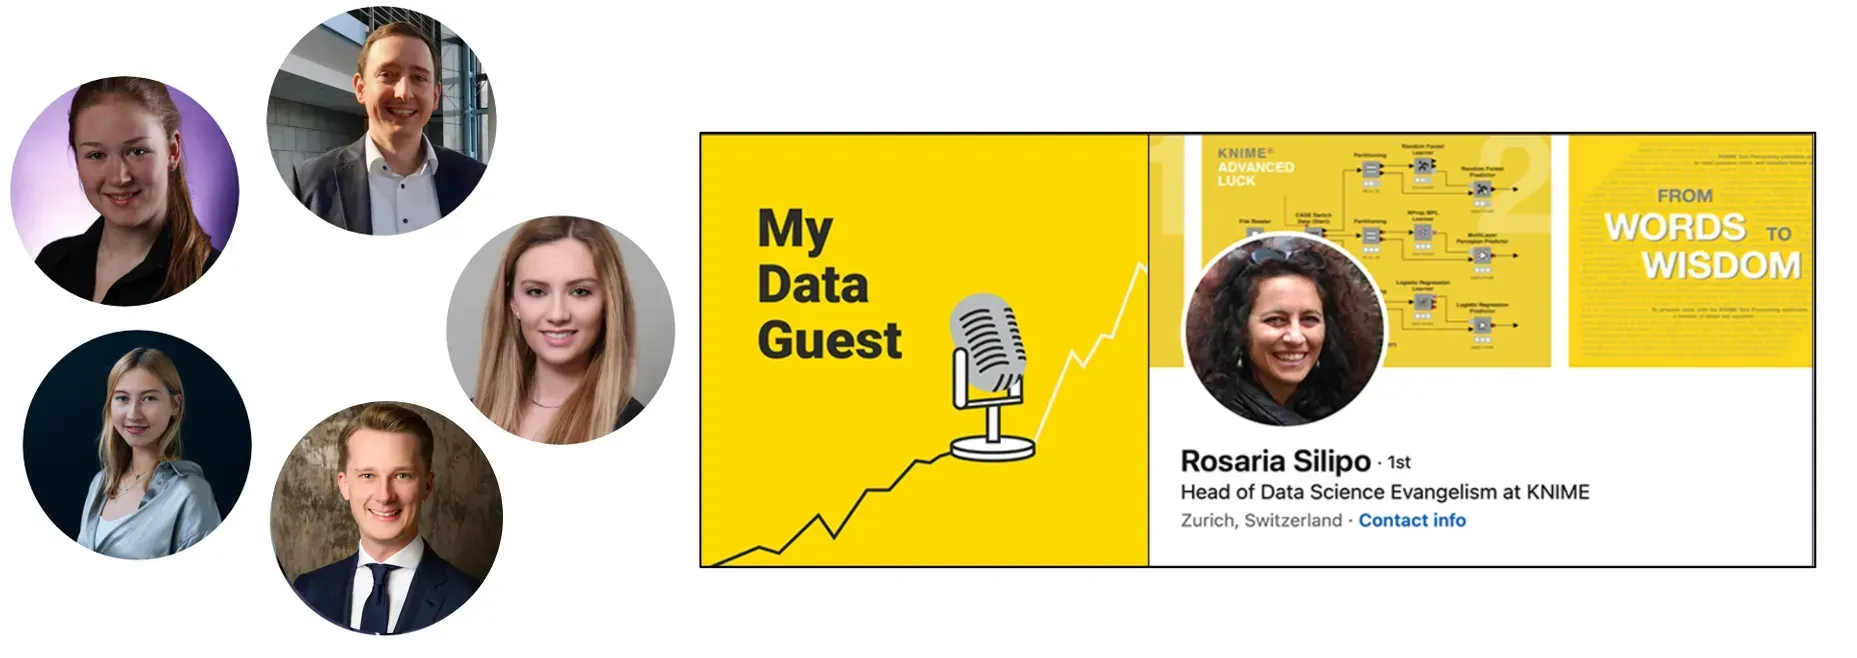
Our Guests
Prof. Dr. Tobias Schlüter is Professor at TH Köln in the Faculty of Business, Economics and Law. His teaching disciplines include data science for business, and applied analytics in banking while his research concentrates on analytics and data science for business and pricing for financial institutions.
The two teams, whose projects got the 1st place in this challenge are all Master students at TH Köln, are composed of Margarethe Groos, Hanna Siebdrat and Julia Hummel (Team 1); and Markus K. Bünnemeyer and Emma Wissmann* (Team 2).
*Editor’s note: Emma Wissmann was unable to join the episode.
Roberto: For this episode, my co-interviewer is Stefan Helfrich. Hi Stefan, would you like to tell us what your role at KNIME is?
Stefan: Sure! I am responsible for the Educators Alliance here at KNIME, our academic program with which we support educators and researchers in their work. That is, I work a lot with professors and educators on a daily basis to help them use KNIME in their courses.
Roberto: Let’s now introduce our guests, get insights into the analysis they conducted, the tools and methodologies used and what they learned throughout this challenge. We hope that other students and aspiring data professionals will find some source of inspiration and motivation in your story.
Stefan: Welcome Prof. Tobias Schlüter; Margarethe, Julia, Hanna from Team 1; and Markus from Team 2. Congratulations on the 1st place, guys!
Roberto: You are all Master students at the Technische Hochschule of Cologne, Germany. Can you tell us a bit more about yourselves and your program?
Markus: First of all, thanks for having us today! I’ve studied Mathematics and Physics as well as Clothing Management in my two bachelor’s degrees. I decided to enroll in the master’s program at TH Köln because I wanted to go deeper into the field of Economics.
Margarethe: I completed my bachelor’s degree in International HR Management, and after that I wanted to gain a broader understanding of Business Management in general. I chose the master’s program in Cologne because it has mandatory classes in taxation, marketing, and accounting. Additionally, there are many electives, such as “Data Science for Business” so students can decide where to place the focus of their studies or simply try different things.
Julia: I also completed a bachelor’s degree in HR and wanted to do a master’s degree at TH Köln to expand my knowledge in the field of Management. As part of our master’s, I decided to take electives such as “Digital Transformation” and “Data Science for Business” to specialize in this field.
Hanna: My bachelor’s degree is in Tourism Management. Just like the others, I wanted to broaden my knowledge in business-related subjects. Even though the master’s degree consists of a lot of general business courses, the majority of them have a strong focus on business leadership. I find that very helpful and interesting.
Roberto: For the non-German speakers in the audience, the name of your master’s program translates into English roughly as “Market-oriented Business Administration”. In recent years, we have witnessed a boom of university curricula at the intersection between data analytics and other domains. What made you decide to take “Data Science for Business” as an elective to combine data analytics with the core subjects in your degree?
Markus: I have a very rational way of thinking and for many decisions, data is a way better basis than to trust one’s gut. To get clear and meaningful information from data, you have to analyze it. I wanted to be able to analyze data by myself, for example, if I have to challenge analyses from other people.
Margarethe: It is interesting what stories data can tell. Learning how to handle data, work with it and use it to make good decisions seemed like a really good addition to my skill set.
Julia: The analysis of data can be used in all areas of a company and provide excellent opportunities to make better decisions. I am also very interested in this area with regard to the ever-growing job possibilities for experts in data analytics and data science.
Hanna: Data has become a major resource for businesses, playing a prominent role in the success of a company. Therefore, being able to handle and work with data is a key competence in the business environment. It’s very helpful to broaden that knowledge already as a part of the study curriculum.
Stefan: How are the knowledge and skills that you are learning being blended in the courses of your degree program?
Hanna: In the elective courses, we learned a lot about the basics and possible applications with data. We saw how data can be used for business intelligence tasks, where it helps businesses make informed decisions. In addition to that, by using machine learning methods we can identify patterns and predict future events, helping identify opportunities for businesses to grow. Just by learning all of these, we implemented projects both in the basic and advanced data science courses.
Stefan: How did your teams come across KNIME Analytics Platform and what was your initial impression of the software?
Markus: The first contact with KNIME Analytics Platform for all of us was in the first semester of our master’s program, during the lecture “Data Analytics” by Prof. Schlüter. I hope I speak for all of us when I say that we were glad we didn’t have to learn how to code. In that lecture, Prof. Schlüter prepared a use case that allowed us to get results quickly. For me, it was very motivating to get these quick results without having to code or deal with big, messy tables. It was enough to drag & drop and connect some nodes.
Stefan: Let’s now talk a bit about the Data Science for Business Challenge “Finance & HR” with KNIME. First of all, were there any specific requirements in terms of sub-industry or analytics area?
Markus (Team 2): Both teams worked on the same project called “Job Market Analytics: Which skills should applicants have?”. The goal was to analyze online job advertisements in Germany to get information about the needed skill set. We focused on job ads in the field of data science, data analytics and business intelligence without limitations to a specific industry. Indeed, our side goal was to compare how those skill sets may differ across different industries. In the way we analyzed the data, we were more or less flexible.
Hanna (Team 1): As Markus already said, both teams worked on the same project, therefore our team had the same requirements and objectives. Using KNIME for data analysis was also a requirement. However, how to actually get the data was not defined. We ended up implementing different approaches for data collection.
Stefan: In the challenge, both top teams analyzed the German job market using a data-driven approach with KNIME Analytics Platform. Can you tell us more about the specific approach of your team and the techniques you used to analyze the job ads and identify the best candidates for the job offers?
Margarethe (Team 1): Usually, you only find a certain number of job offers when you are looking for a job. Analyzing more than 20.000 job ads, we aimed to provide an overview and orientation for job seekers in the field of data science and data analytics. From each job ad, we scraped a broad range of information, such as job title, company, location, and job description, which listed the required qualification and skills. For web scraping, we wrote a Python script and stored the data in an Excel sheet. Next, we imported the Excel file in KNIME for further analysis. We analyzed specific skill frequencies in order to make a statement on the importance of each information. In this way, candidates can assess their chances of getting a job based on their qualifications and skills, the regions in Germany, companies or industry/sectors. Our workflow also gives suggestions on how to improve the candidate’s profile to become even more attractive for employers. For example, candidates could get insights into whether it would be worth it to invest in further education, to move to a different region, or which companies to apply to.
Markus (Team 2): Our team also used Python to scrape data. In comparison to Team 1, our code was just getting overview pages after searching for terms, such as “data science” and “data analytics”. After getting the overview pages, we used KNIME to extract all necessary data. We used KNIME nodes to read in HTML blocks from single job ads, to separate the relevant parts of the HTML blocks and convert them into structured data. Like the other team, we analyzed the structured data to be able to say something about the skills needed and the regions in Germany with a high demand for data scientists. To this end, we analyzed all job ads together, and drew comparisons between industries and hierarchical levels.
Roberto: (For Team 1) How did you come up with the hypotheses that you tested out and how did KNIME Analytics Platform help you test these hypotheses?
Margarethe: We designed our project taking the job seeker’s perspective. Hence, we decided to analyze four categories: qualification, skills, company and location. In doing so, we relied on the findings of the literature research on qualification and skills, which were mostly collected in the US. This showed that there was an urgent need for analyses beyond the American market. We were very motivated to do that for the German market, and ended up testing eight hypotheses to find answers to 24 questions in total. KNIME helped us by providing us with a low-code end-to-end tool for our analysis. Additionally, its visual programming paradigm made it easier to focus on building workflow branches that we used to test in parallel different hypotheses.
We analyzed the frequency of the four categories and tested the hypotheses applying certain filters. For example, we conducted a test to compare the skill set of employees without managing responsibilities to that of managers. Furthermore, we used a node to create a heatmap that visualized what regions or cities had a high number of job offers published. The visualized outcome turned out to be very informative.
Roberto: (For Team 2) When answering the question of ‘What makes a data scientist?’, what assumptions did you make for your project, and how were they developed?
Markus: Firstly, we searched the literature that dealt with this question. In most cases, the results were very similar. Sometimes, however, they contradicted each other with respect to which programming language was most frequently required. Based on these studies, we came up with four hypotheses.
The first hypothesis stated that “data scientists are expected to have fewer social skills but mainly technical skills”. The second one stated that “data scientists are only sought in metropolitan areas in Germany”. The third one stated that “the higher the hierarchical level of the position, the more social skills come to the fore”. And the last one stated that “Python dominates the technical requirements”.
Roberto: (For both teams) Based on your analyses of the job market, were the outcomes expected or surprising?
Markus (Team 2): Out of the four hypotheses we tested, we could only confirm one of them, namely that “data scientists are expected to have fewer social skills but mainly technical skills”. Contrary to our expectations, the requirements for social skills do not increase with increasing hierarchical level. Rather, it seems to be strongly desirable across all levels. Furthermore, it was interesting to observe that companies do not search for data scientists just in metropolitan areas but also in rural areas. Also, we thought that Python would be the most dominating requirement, but that was not the case. There was not a single technical skill that dominated the requested skill set across every position. Other exciting findings were that English skills and initial experience in data science were especially important to employers. It surprised us that it was not a degree in computer science but a degree with a business background that was most frequently requested.
Julia (Team 1): Our results were also quite surprising. We found out, for example, that professional experience played a far more prominent role than a formal degree. A master’s degree is not necessarily required. In terms of skills, we found out that soft skills are much more important than hard skills or the ability to use a specific software. The reason is that hard skills can be learned on the job, whereas soft skills tend to be more a natural trait. This is particularly the case in management positions, where excellent soft skills are even more frequently required.
Stefan: Can you tell us about a specific feature, node or component in KNIME Analytics Platform that was particularly helpful during the Challenge?
Margarethe (Team 1): The KNIME filters were very useful. The Column Filter and the Row Filter are basic nodes but they always come in handy. Another key node was the String Manipulation node. Without it our workflow and results wouldn’t have been equally clear. Especially for the analysis of the location, the String Manipulation node was essential because cities were often spelled differently using abbreviations, or the delimiter was different. With the String Manipulation node, we normalized strings by setting a standard delimiter and defining one standard way of spelling a city. Likewise, the GroupBy node was key to aggregate and display results.
Markus (Team 2): There are a few nodes that have been very helpful for us. First of all, the Cell Splitter node. To parse the HTML blocks of the job ads, we split the code into individual parts that were separated by specific tags. Secondly, the Table Writer and Table Reader nodes. We had to handle more than 20,000 job ads –a very large dataset. Since we worked with our private laptops, we had limited RAM resources. To cope with it, we saved the interim results using the Table Writer node, reset the workflow and reloaded the saved interim results back into the workflow with the Table Reader node.
Stefan: How did your teams divide up the tasks and responsibilities for the “Finance & HR” Challenge with respect to your prior knowledge? And how did you ensure that everyone’s strengths were utilized?
Markus (Team 2): We tackled the challenge as a team of two students. Emma is very good at researching and presenting concepts, so she mainly took care of the background research and presentations. She is also very good at focusing on the goals without getting side-tracked. On the other hand, I am a very analytical person and I can keep a cool head even in complex tasks. So I was responsible particularly for setting up the workflow. The combination of our skill sets took care of the results.
Julia (Team 1): In our team, none of us already had extensive knowledge of data science. As a result of it, we worked together a lot, especially at the beginning of the project in order to benefit from the mutual exchange. Towards the end, we divided the analytical tasks to investigate the four major categories of our hypotheses. Hanna was responsible for the analysis and interpretation of work experience and academic background, Margarethe for the location and I for the analysis of skills.
Roberto: Can you tell us about the most challenging aspect of the Challenge and how your team overcame it?
Markus (Team 2): For me personally, the most challenging aspect was not to get lost in details. So Emma regularly had to remind me to keep the focus on achieving the goal.
Julia (Team 1): During the project, Hanna, Margarethe and I each lived in different countries and also in different time zones. In addition, unlike our fellow students, we also had completely different schedules. Of course, this also caused organizational difficulties. Within the project, the beginning was quite difficult for us. We had no idea about the topic at all and had to try many different approaches to collect the data we needed. That took a lot of time and effort.
Margarethe (Team 1): I can add that we split the workload into smaller tasks so everybody tested different hypotheses, like Julia described earlier. Due to our schedules, there were not many options to work on the workflow at the same time. As the project slowly came together, we realized that there was room for efficiency improvements. Therefore, at the end we had to put in some extra work to make the workflow more efficient.
Hanna (Team 1): We also had some technical issues to make our code portable. On some laptops our Python code worked, but that very same code would not work anymore on a different laptop. We spent a lot of time deleting and installing dependencies and packages to create the same “technical starting point”.
Roberto: What was the most rewarding aspect of the challenge?
Markus (Team 2): The most rewarding aspect was the steep learning curve because the challenge was part of a lecture. I think it’s just natural for us, as students, to honor what we’ve learned.
Margarethe (Team 1): Also for me, it was the steep learning curve.
Julia (Team 1): I agree with my fellow students. We really learned a lot in the project: from coding in Python, to the ups and downs of a long-term project, and the importance of teamwork in challenging tasks.
Hanna (Team 1): I can only agree with that –very steep learning curve!
Stefan: Let’s now turn the table and take the educator’s perspective. How did you come up with the idea of a student challenge? Did you start with a theoretical framework and adapted the project requirement accordingly? Or did you start from the data?
Prof. Schlüter: I came up with this project thanks to the experience shared by Prof. Francisco Villarroel from the LUISS University in Rome, who organized such a challenge with KNIME in the past. I thought that it would have been a great idea to create a similar experience at a German university. I contacted the KNIME Educators Alliance and we discussed if we could set up such a challenge at TH Köln. I really liked the concept because it gamifies data science teaching.
I set up various cases in different industries and sectors. For example, with PWC we asked ourselves: “Should the insurance price of electric vehicles be different from non-electric vehicles?”. Or, together with parcIT, we analyzed the behavior of bank customers. In general, the search for industrial partners in Cologne was fairly easy. Many companies were interested in getting in contact with students, letting them analyze a “real question” and getting to know them over 4 months. Together, we analyzed the business question and asked ourselves: “Can students answer that business question in 4 months?”. Based on this, we aligned the project focus and process of each use case. The data came after.
Stefan: Would you recommend adopting elements of gamification in the learning/teaching process to fellow educators?
Prof. Schlüter: Definitely! I think that the gamification of data science is a brilliant idea to encourage students to have a very steep learning curve. In my professorship, I have long asked myself how I can bring data science closer.
Statistics, mathematics or quantitative methods aren’t usually the subjects business students would put at the top of their interests. With real use cases, project structures, real applications and interest from companies, however, I created a learning environment in which students are happy, motivated and extensively engage with these topics, discuss them, question approaches and even reject them once in a while. The gamification of data science teaching, or the gamification of statistics, creates a learning environment from which students take away so much more than from textbooks. At the end of this journey, I can say that all the teams conducted a much more sophisticated data analysis than I would have ever expected.
Stefan: Will you organize a new challenge in the near future?
Prof. Schlüter: Yes, definitely. In Cologne, when we do something more than once, it automatically becomes a good, old tradition. The Data Science Challenge will be no exception at our university. Currently, we are organizing the next edition that starts in September 2023. We will again have cases provided by one of the Big4 consulting companies and risk-related use cases from the banking industry. I’m looking forward to an energy pricing use case, which is a really hot topic at the moment. We will try to answer questions such as: “How can we predict and hedge energy prices by applying data science techniques?”.
Stefan: What motivated you to incorporate the use of KNIME Analytics Platform into your course and for this challenge?
Prof. Schlüter: The main motivation to use KNIME Analytics Platform as the go-to tool for the challenge was its low-code environment. My opinion about the students’ interests is that learning how to code is not the main interest or focus. I needed a tool that can be easily adopted and learned by business students. In about two hours, students are able to work with KNIME. That is why I think students should work with a visual programming-based software.
The main reason, though, was the natural ability of low code tools like KNIME to transparently communicate the data flow to stakeholders. None of the corporations in the Finance&HR Challenge used KNIME Analytics Platform as their primary analytics tool. Nevertheless, even when our workflows grew quite large, it was still very easy to explain to the professionals from the corporations the different parts of the workflow, e.g., data preparation, visualization and predictive modeling. After 5–10 minutes, our business partners were able to describe the main logic of the workflows and from where to where the data was flowing. That’s priceless.
Roberto: How do you see the field of data analytics evolving in the next 5–10 years, and how do you ensure that your course and your challenge stays up-to-date with these changes?
Prof. Schlüter: We live in a very exciting time. We are currently experiencing the democratization of data science, statistics and data analysis. Nowadays, many data analyses can be carried out by a much larger group of users with easy-to-use tools. Data science is no longer the exclusive realm of mathematicians, physicists or computer scientists. Increasingly, use cases and solutions can be built by graduates or employees who had a different focus in their studies or professional training.
This change is reaching various industries. Certainly, the focus was on marketing or cross-selling data science approaches at the beginning of the data science trend. Increasingly, however, we are also seeing the use of data science techniques in “downstream functions” in sectors such as auditing, legal services or HR. I believe that this trend will continue to accelerate and broaden, bringing with it new sectors, industries and professional profiles.
Roberto: We are reaching the end of our conversation. Before we say goodbye, we have a few more questions for the students. What resources (e.g., publications, books, online journals, social media, etc.) do you usually use to keep yourself up-to-date about the newest trends in the space?
Markus: I’m following different experts on LinkedIn who are blogging and posting about data analytics. As I’m writing my master’s thesis this semester about data science in the fashion industry, I’m reading a lot of publications, books and other scientific material about it.
Margarethe: LinkedIn is my main source of news, so I read articles or posts that are shared there.
Julia: It is the same for me. I keep myself up-to-date with LinkedIn a lot but also listen to podcasts.
Hanna: I use mainly social media, although I try to listen to podcasts and would like to do that more often.
Roberto: Our closing question looks forward into your future aspirations. When are you graduating and what are your plans for the future?
Markus: My plan is to graduate in August. For what comes next, I’m very open-minded with no concrete plans right now. The only condition is that it must have to do with fashion. So if anyone has any ideas, feel free to reach out.
Margarethe: I will graduate in February 2024 and I would like to start working right after my graduation. At the moment, I see myself working in the controlling or analytics field.
Julia: I will graduate in August and want to start a job as a consultant in the field of digital transformation or even data science.
Hanna: Just like Margarethe, I will graduate in February 2024. I would like to attend a 3-month development bootcamp in the field of web development. My previous work experience was in digital marketing so I’d like to see if I can go into frontend development.
Roberto: Thank you all for joining us and best of luck in your future projects!
Watch the original interview with winners of the Data Science for Business Challenge “Finance & HR” at TH Köln on YouTube.
Teilen
Auf dem neuesten Stand bleiben
Registrieren Sie sich und Sie werden stets über Neuigkeiten informiert.